Check Our Grades for 200+ Long Island Sound Beaches
Download your copy of the 2025 Beach Report
Download previous Beach Reports: 2023 • 2021 • 2019 (updated Nov 2020)
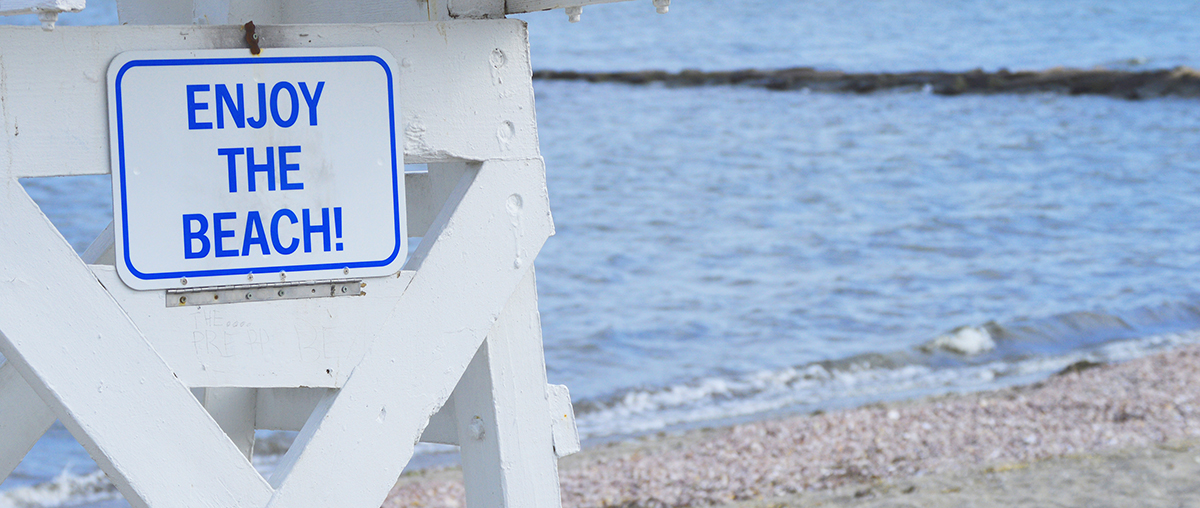
At simultaneous press events in New Haven, on Long Island, and in the Bronx, Save the Sound released our 2025 Long Island Sound Beach Report on May 20, just days before Memorial Day Weekend and the start of a new swimming season. The Beach Report offers good news for swimmers, noting that 72% of nearly 200 public and private Sound beaches earned “A” or “B” grades for water quality in the 2024 swimming season. The biennial report presents comprehensive grades for 204 swimming beaches from 2022 through 2024 and includes a list of the 10 highest scoring public beaches in both New York and Connecticut based on a three-year average of water quality grades.

The Beach Report also lists the region’s 10 lowest scoring public beaches.
Beach Grades are assigned based on how water samples collected by health departments around the Sound perform against state safe swimming criteria. Samples are collected throughout the swimming season under wet and dry conditions and are analyzed for levels of fecal indicator bacteria. The 2025 Beach Report raises concerns about the water quality impacts of rain events driven by climate change. That overall percentage of A and B grades was down from our last Beach Report, when 78% of the monitored beaches received a B- or better.
The Long Island Sound region averaged 18.3 inches of rain over the last three years, which matches 2011-2013 as the highest three-year total in our records dating back to 2003. Annual rainfall totals are expected to continue increasing, as is the frequency and intensity of severe storms, a consequence of climate change that will impact water quality around the region.
Download your copy of the 2025 Beach Report

Based on a three-year average of annual failure rates, wet weather fails across Sound beaches rose from 11.0% (2020 to 2022) to 13.5% (2022 to 2024), an increase due in part to the failure rate in the westernmost region of the Sound that combines Westchester County and New York City: 14.9% in 2020–2022, versus 20.8% in 2022–2024. Failure rates in other regions were up, as well, most notably Suffolk West (up from 8.7% to 12.1%), Connecticut East (7.1% to 10.3%) and Connecticut West (10.9% to 15.6%). During dry weather, samples overall failed 5.1% of the time, an increase from 4.2% in the 2023 report.
“Our 2025 Long Island Sound Beach Report demonstrates just how urgent it is that we prioritize new investment in sewage and stormwater infrastructure,” said David Ansel, vice president of Save the Sound’s Center for Water Protection. “If we’re not proactive, the impacts of climate change will undo so much of our successful past and ongoing work in restoring the water quality of the Sound.”
The 2025 report identifies the most common stressors that threaten water quality at beaches around the Sound. It also spotlights efforts being made at the state, municipal, and community level to address those challenges and lists what individuals can do to protect water quality and help keep our beaches open.
A deep dive into the data behind the grades in the 2025 Long Island Sound Beach Report, as well as historical data, can be found at www.SoundHealthExplorer.org/swimmable.

Residents, as well as local and regional officials, are urged to check www.soundhealthexplorer.org for data regarding specific beaches. Often, issues forcing beaches into frequent closures can be addressed when local water quality patterns are carefully assessed and associated pollution sources identified.