

Last week, we introduced our Science and Policy Series on Greenhouse Gases. Today, we offer our first post, which looks at the effect of the COVID pandemic on CO2 emissions and the relationship between emissions and our global economy.
Please welcome our guest blogger, Johan C. Varekamp, whose combination of professional expertise and straightforward explanations offers the opportunity to digest this complex topic in easy-to-understand terms. Professor Varekamp is Harold Stearns Professor in Earth Sciences, emeritus, at Wesleyan University in Middletown, CT. He has authored approximately 80 publications on environmental geochemistry and volcanology. In addition, he has provided outreach to civic and religious groups on climate change, sea level rise, and mercury pollution and currently serves on the board of Save the Sound, for which he is a past board chair. We hope you’ll share what you learn—and share this post!—with others.
When the coronavirus pandemic hit the USA head-on in March 2020, life changed dramatically for all of us. No one was flying, the streets were almost deserted because no one was going to visit friends or family, and our cars remained parked. We worked from home, and office buildings were only marginally occupied. This led to a reduction in economic activity of ~ 7% in 2020 (Statista). One net result was a decline in oil use during 2020, with a ~ 9% drop in liquid fuel use relative to 2019. Other energy sources such as coal and natural gas also were in less demand, and we therefore expected an overall decline in the emission of CO2 into the atmosphere during the 2020 pandemic year.
As most of you know, the concentration of CO2 in the atmosphere is one of the regulators of global climate through the greenhouse gas properties of CO2. More CO2 means warmer, as has been shown over and over again from the long-term geological record, which can be read through studies of old sediments and ice cores. Studies of ice cores from the Antarctic (Figure 1) show that during the past ice ages (glacial periods), the air contained only about 180 ppm CO2 (ppm = parts per million, 1 ppm is one molecule of CO2 in a million molecules of air), whereas during the periods between ice ages (interglacials), when it was globally about as warm as the time before the Industrial Revolution, we found up to 300 ppm CO2. That increase of 120 ppm CO2 correlated with a maximum rise of 12 oC in the average temperatures in the Antarctic where the ice cores were taken—“warm” in the Antarctic is still a rather chilly 4 oC.
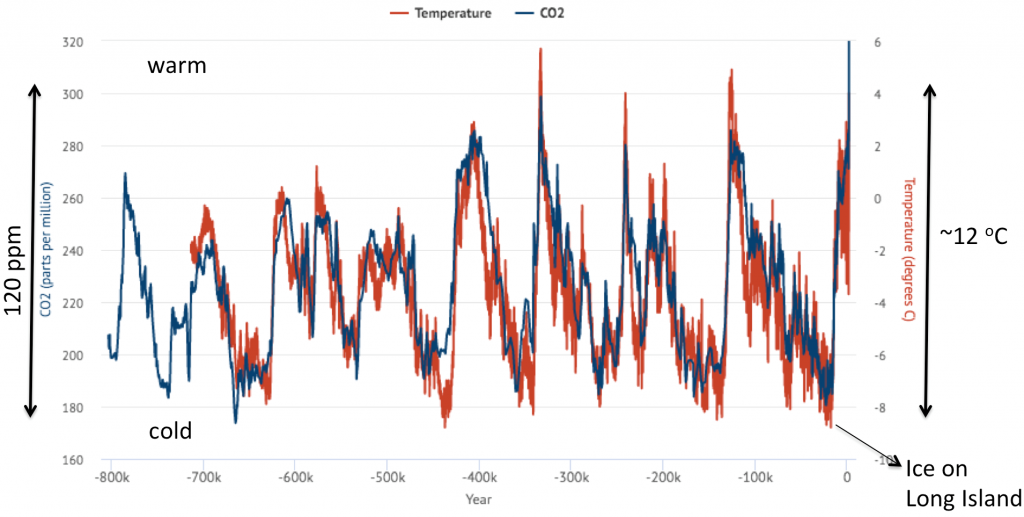
The 12 oC warming is not only the result of the greenhouse effect of CO2, but also influenced by the reflectivity (or albedo) of the earth. The continental icecaps retreat polewards during global warming at the end of an ice age. For example, at the end of the last Ice Age the ice sheets retreated from Long Island back to the Arctic Ocean. It is somewhat hard to believe (but true!) that CT was covered with 1 km ice thickness or more about 20,000 years ago. When these ice caps become smaller, more of the solar radiation is absorbed by the earth instead of being reflected back into space by the snow and ice cover of the continent. As a result of many factors involved in global warming, including the albedo, the relation between atmospheric CO2 content and global temperature is far from linear.
The CO2 concentration today is ~ 419 ppm, a dramatic increase since the early 1800s (280 ppm), and this rise is a result of fossil fuel burning (and deforestation) to satisfy the demand of all our industries and our own mobility. Many of today’s economic discussions revolve around stimulating the economy while reducing our output of greenhouse gases (mainly CO2 and methane, CH4 or natural gas) into the atmosphere. The magic words here are that we are aiming for carbon neutrality; that is, we like to see an economically active world without adding more of these carbon-bearing greenhouse gases to the atmosphere. The Paris Agreements call for reductions in carbon greenhouse gas emissions of 50% by 2030 relative to 2019, with the ultimate aim to keep the global temperature rise below 1.5 to 2 oC (2.7 – 3.6 oF).
What do we know about the CO2 emissions over the last 100 years, and how do 2020, 2021, and 2022 stand out?
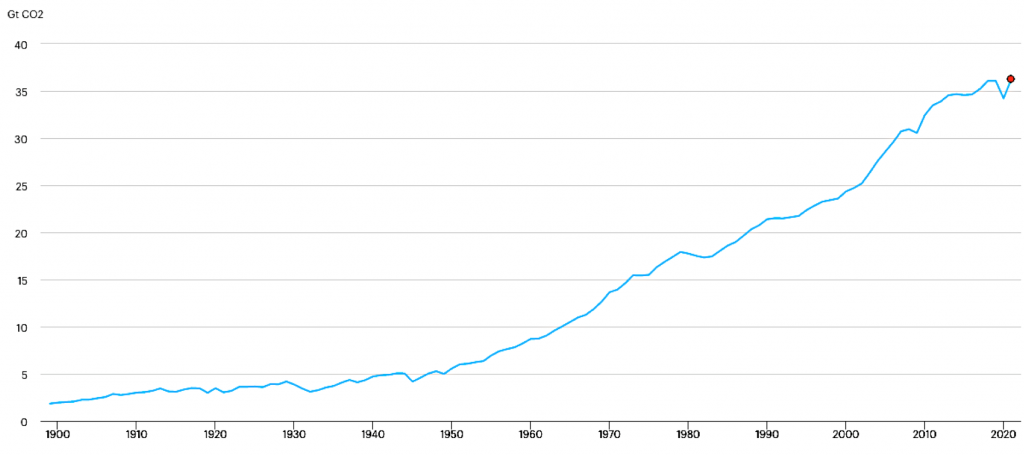
Figure 2. CO2 emission record from fossil fuel burning, from 1900 to today in billions of tons of CO2 or Gigatons/yr.
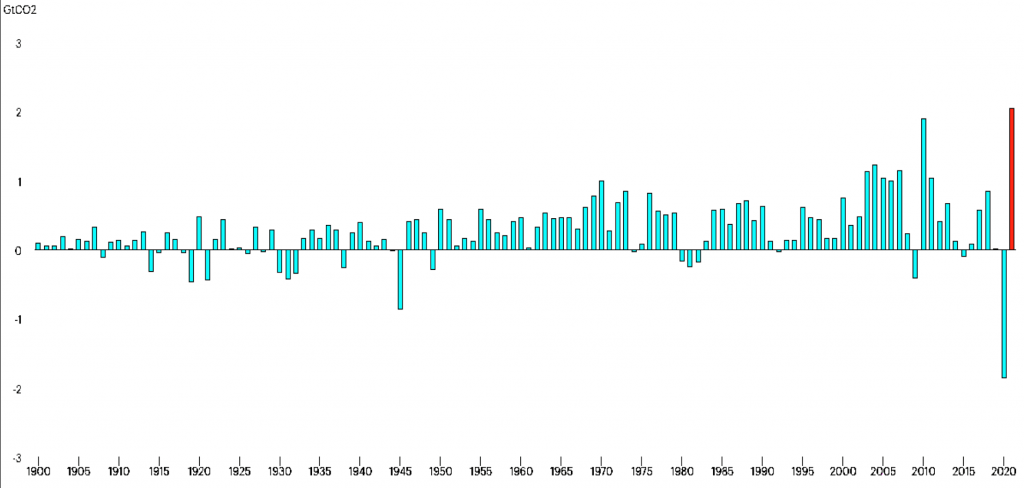
We calculate these emissions using records collected from worldwide sales and tax invoices for oil, coal, and gas. The 120-year record of CO2 emissions from fossil fuel combustion alone (Figure 2) shows the seriousness of the human impact on the CO2 contents of the atmosphere: in 1900, about 2.5 billion tons (Gt) of CO2 were released into the atmosphere. That release rate rose to 25 Gt CO2 by 2003, a factor of 10 increase in ~ 100 years. Nowadays, we emit around 36 Gt CO2 per year, but we see a sudden decrease in 2020 of almost 2 Gt CO2 (Figure 2 and 3) compared to 2019. This is the biggest annual drop since 1900, about 5% down relative to 2019, so quite an impressive event. We see other significant drops in CO2 emission rates during WW II, the early 1980s economic crisis, and the 2008 financial crisis.
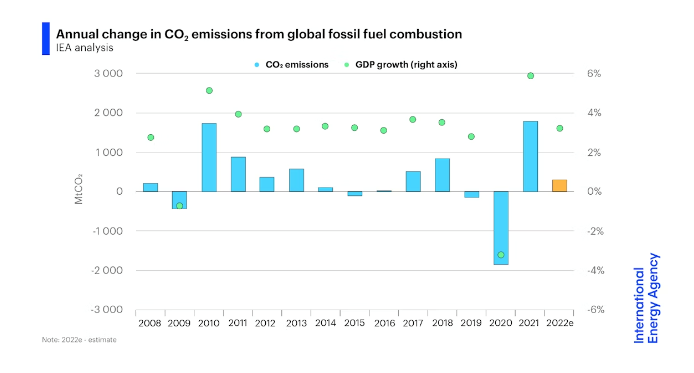
In late 2020 we thought that the pandemic was on its way out, and the economy recovered strongly in 2021, leading to CO2 emissions that rivalled those in 2019 (36.3 Gt vs 36.1 Gt). In 2022, the CO2 emissions increased only by about 0.3 Gt CO2, but the GDP was much lower than in 2021 (3.3% vs almost 6%). The IEA heralded this in their annual report as strong evidence that the contributions of ‘green energy’ had dramatically increased and finally showed an effect on our CO2 emission rates. As shown above, with that 3.3% GDP growth rate, we would expect a more modest increase in emissions rate, even without the new green energy providing a slightly larger share of the energy mix. These data put the expectations for the Paris Accords into context: with all this economic mayhem in 2020, we reduced the CO2 outflux by almost 2 Gt. To reach about 50% of the 2019 emission level in 2030, we would have to cut down emissions from now on every year by somewhat more than the ‘pandemic decline’ of 2020 and even then we would still be adding ~16 Gt CO2 per year to the atmosphere in 2030, the same rate as in the mid 1970s (Figure 4). A 7.6% annual drop in emissions every year between 2020 and 2030 would probably satisfy the Paris Accords, with close to carbon neutrality around 2050 (Figure 4).
“… [M]ajor advances in green energy have to be implemented if we want to maintain the current rate of GDP growth and decrease emissions as well.”
In essence, all the 27 COP meetings have had only minor effects on the CO2 emissions growth rates: we are still emitting each year more than the year before (except during economic recessions and depressions), but the growth rate has decreased from ~2% in the 1970s to 0.84% in 2022, the latter occurring over the last few years. Several countries have “peaked” with their CO2 emissions between 1990 and the early 2000s as a result of a switch from a coal-based economy to a gas-based economy: during combustion of natural gas less CO2 is released compared to coal for the same amount of heat generated. Nonetheless, we are still on a positive emission growth pattern, and major advances in green energy have to be implemented if we want to maintain the current rate of GDP growth and decrease emissions as well.

We could say that 2020 was an involuntary step in the right direction, but it was a crisis year in an economic sense. In 2021 we bounced back toward our “business as usual”, and we were then and in early 2023 back at slightly above 2019 emission levels. The Paris Accords were set in 2015, and we have not shown much progress in reducing our global human CO2 flow into the atmosphere since that year. The required rate of decline in CO2 emissions in this coming decade will have to be much faster than the climb from 1900 to 2020 to stay below a 2.0 oC temperature rise (Figure 4). Obviously, we will have to overhaul our energy needs completely in order to reach emission levels as agreed to in the Paris Agreements, which means a combination of reductions in energy demand (efficiency) and turning largely to green energy sources, ranging from windmills and photovoltaic to nuclear power generation. We have our work cut out for us!
Recent newspaper articles reported that the annual CO2 emissions from each country may be well below the true emission values, up to 25% too low—that is a scary issue and needs to be looked at. In addition, deforestation processes in the world also create a CO2 flow into the atmosphere, considered to be much smaller than the fossil fuel combustion flux, and not incorporated into Figure 1. However, another article reported that the increase in wildfires all over the world associated with recent droughts and global warming may have created a much larger CO2 flux from forest loss than estimated before. So there are still uncertainties in our primary CO2 emission data, whereas the atmospheric CO2 measurements are very solid.
In the next blog I will look at atmospheric CO2 contents and evaluate the response of atmospheric CO2 levels to the 2020 pandemic drop in CO2 emissions.