

Our Science and Policy Series on Greenhouse Gases continues today with this post on atmospheric CO2 contents and the response of atmospheric CO2 levels to the 2020 pandemic drop in CO2 emissions.
Guest blogger Johan C. Varekamp is Harold Stearns Professor in Earth Sciences, emeritus, at Wesleyan University in Middletown, CT. He has authored approximately 80 publications on environmental geochemistry and volcanology. He has provided outreach to civic and religious groups on climate change, sea level rise, and mercury pollution and currently serves on the board of Save the Sound, for which he is a past board chair.
In the first blog, we looked at the impact of the pandemic on the emission rate of CO2 from gas, oil, and coal burning and noted that in 2020 a decrease of about 5% took place (-1.8 Gt CO2 relative to 2019). I put that amount in context with the Paris Climate Accords that require all individual countries to set benchmarks in CO2 emission reductions so that we are moving in a global sense towards carbon neutrality. The aim is to keep the global temperature below a 1.5 to 2.0 oC rise by 2050, and the required approximate emission trend shows a steep decline over the next 30 years (Figure 1).
If the past since the 1997 Kyoto protocol is any help, we will have a hard time accomplishing these Paris Accords goals. It seems we just keep doing what we always did—that is, increasing the CO2 flux to the atmosphere, currently by about +1% extra per year, as we have done over the last 100 years at on average close to 2% per year. Despite the Kyoto Protocol and all the other climate conferences, the emissions kept going up and up. Extending that trend into the future, we will end up with a CO2 emission rate of ~ 68 Gt/year in 2050, which is about two times the current rate. That sure would lead to significantly greater global warming than 2 oC by 2050. Why do these emissions keep rising every year? 1. Population growth (more people, more energy demand) and 2. Increase in the standard of living (everyone wants a refrigerator, a car, air conditioning and more).
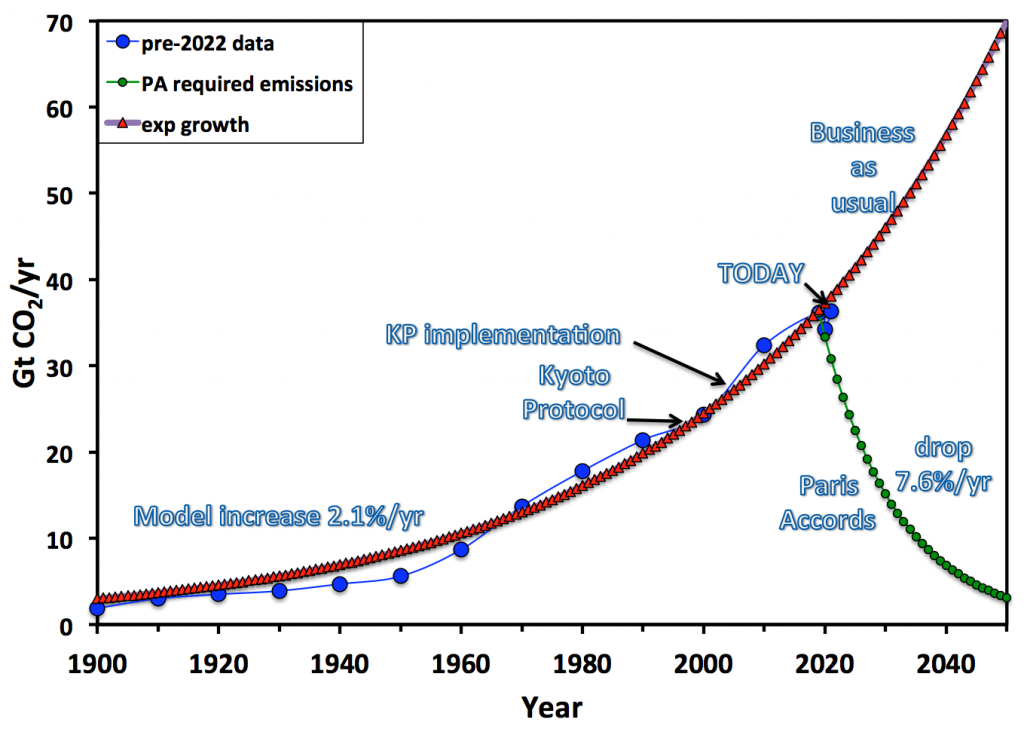
Figure 1. CO2 emission scenarios from 1900 to 2050. The red curve from 1900 until today reflects an annual increase of 2.1 %, which when extrapolated to 2050 would lead to a CO2 emission of ~ 70 Gt for that year. The carbon neutrality trend of the Paris Accords (in green) demands a ~7.6% decrease per year to reach close to zero emissions around 2050. The Kyoto Protocol has had almost no influence on the rate of burning of fossil fuels.
In this blog, I would like to look at how these changes in CO2 emission rates translate into atmospheric CO2 contents, which is ultimately an important factor that regulates the amount of warming through the “greenhouse effect.” The amount of CO2 in the atmosphere prior to ~ 1850, the year when large-scale burning of coal started (the Industrial Revolution) was about 280 ppm (from ice core measurements). In 2023 we were looking in January at ~ 421 ppm CO2, roughly a 50% increase from 19th century values in close to 175 years. And all of that was the result of burning of fossil fuels like coal, oil, and gas as well as deforestation.
The Industrial Revolution brought modern appliances, cars, better heating and cooling, and electricity. With that came pollution, including CO2 pollution. The strength of the CO2 pollution from coal, gas, and oil burning was discussed before in billions of tons of CO2 per year (a billion tons is a thousand million tons of CO2 or 109 tons, where a ton is ~ 2200 US pounds). These are humongous numbers, but realize that the U.S. alone burns close to 20 million barrels of oil per day to keep us driving, electricity going, and planes flying. That is 7.2 billion barrels of oil in 2021 alone! A barrel contains 42 gallons of oil and weighs ~ 140 kg. Oil consists of about 85% carbon, which during combustion combines with oxygen to form CO2. Adding that all up, one barrel of oil produces upon combustion close to 0.5 ton CO2. So, those 7.2 billion barrels of oil burned in 2021 created then a U.S. contribution to the global CO2 input of 3.6 billion tons CO2: close to 10% of the total global CO2 flux in 2021, and we are not yet talking about gas and coal contributions.
“It seems we just keep doing what we always did—that is, increasing the CO2 flux to the atmosphere…”
The U.S. population is about 4.2% of the current world population, so our contribution to CO2 pollution is substantial on a per person basis. A comparison of CO2 emissions per person (Figure 2) indicates that the developed world is still an important polluter, but China with its enormous population has now passed the western world in CO2 emissions. The U.S. produces about 14 tons CO2 per person per year, well above the average of the industrialized world (advanced economies). One reason is that energy is cheap in the U.S. relative to, for example, Europe, where regular gas in Germany and Holland costs about $8.0 to $8.50/gallon versus ~ $3.5/gallon in CT today. It is important to realize that the declining trend in CO2 emissions per person in the western world is largely the result of the transfer of manufacturing from the advanced economies to China (globalization). We still use as many products as before or more, but the CO2 released to produce them is now emitted by China and not by the western world. Only a small percentage of that decrease is the result of green energy generation, although that is growing over time.
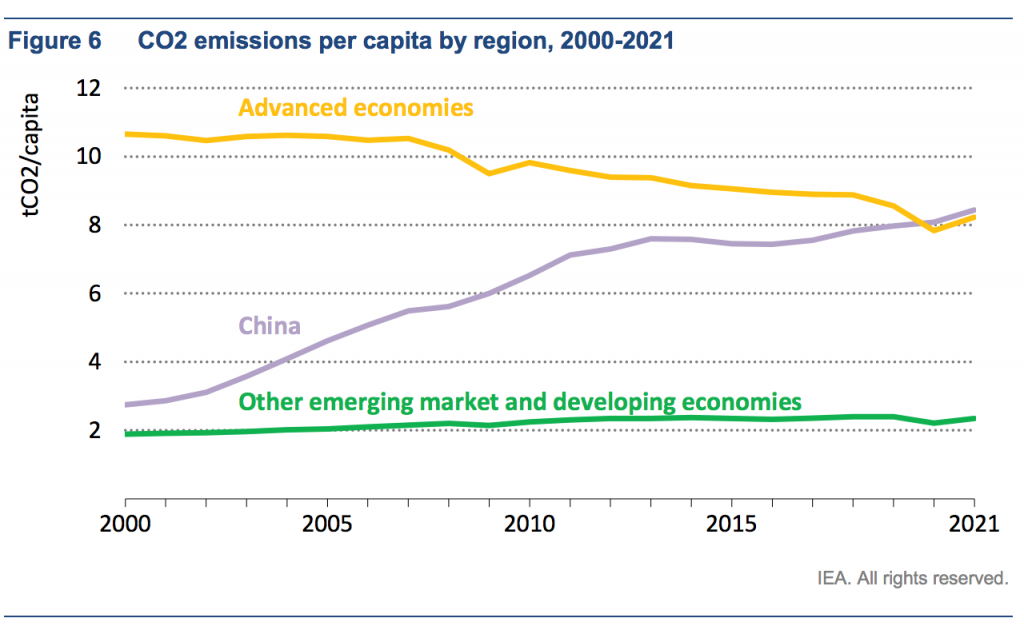
Figure 2. CO2 emissions per person per year for the various groups of countries in the world.
Prior to the Industrial Revolution, the CO2 cycle was reasonably well balanced by natural processes. Photosynthesis on land extracts CO2 from the atmosphere and creates leaves and trees according to:

The same process occurs in the oceans with small unicellular algae. But all that organic material on land and in the oceans decays upon death or dropping of the leaves from trees, reversing the reaction above, and then releasing that CO2 again into the air. Most of the continents on earth are in the northern hemisphere, and most of the terrestrial vegetation is also found north of the equator. As a result, the seasonal cycle of spring-summer photosynthesis (CO2 uptake from the atmosphere) and, during the fall, dropping of leaves with subsequent rot and oxidation (return of CO2 to the atmosphere) creates a seasonal cycle in atmospheric CO2 contents (Fig 3 for year 2018 to 2023). The magnitude of fluctuation is up to 8 ppm CO2, dependent on the latitude, and that signal slowly propagates into the southern hemisphere with almost no seasonal variation in the Antarctic. The oceans have organic activity everywhere, and with spring in the northern hemisphere, fall happens in the southern hemisphere, and increases and decreases in atmospheric CO2 uptake largely cancel. The tropical land regions have little seasonal effects, so the jungles of the Amazon and Africa do not create much of a seasonal atmospheric CO2 oscillation either.
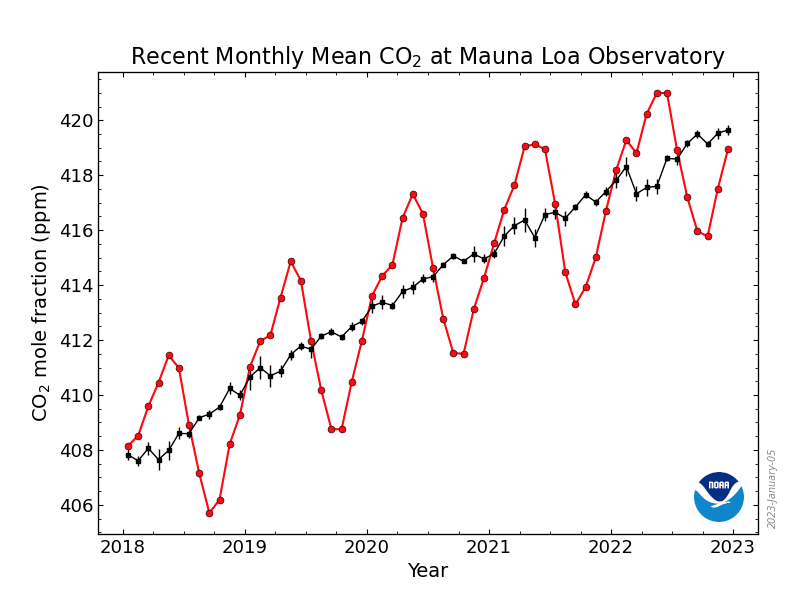
Figure 3. Atmospheric CO2 trends at Mauna Loa (Hawaii) showing the seasonal variation (red line) and a de-seasonalized trend in black. True mean atmospheric CO2 rose from 408 ppm to 419 ppm in 5 years (~ 2.2 ppm per year).
I mention all this because, as one can see, with these seasonal fluctuations it is not so easy to see if there are small changes in atmospheric CO2 contents from year to year. One ppm CO2 in the atmosphere is equal to about 7.8 Gt CO2 when summed over the whole atmosphere. So a decrease in CO2 emissions as we saw during the pandemic (1.8 Gt CO2 less relative to 2019) would cause, in the simplest form, a decrease in rise of ~ 0.23 ppm CO2 if all that fossil fuel CO2 ended up in the atmosphere, which is pretty much impossible to detect in the red dots of Figure 3. On top of that, part of the atmospheric CO2 is dissolved in the oceans and plants take it up, so the atmospheric CO2 effect of the pandemic will be almost imperceptible (<0.1 ppm down), also given the above fluctuations over the seasons by 8 ppm CO2.
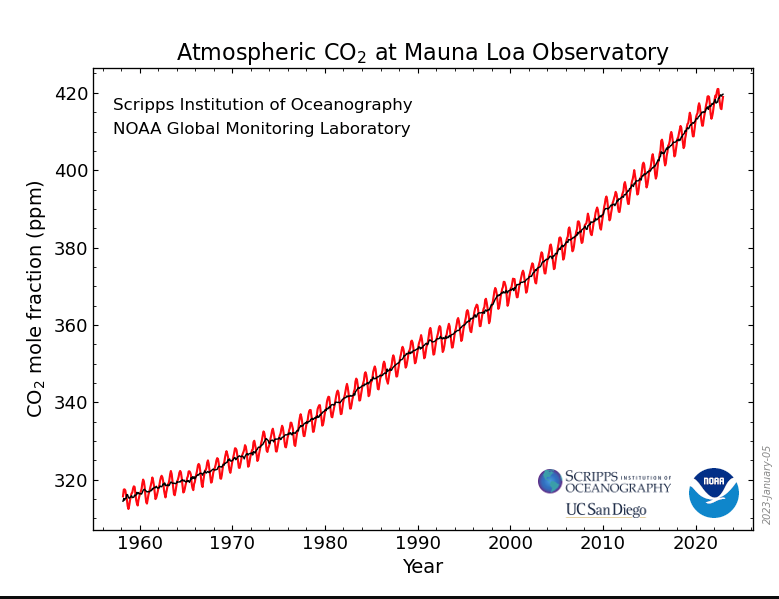
Another effect to take into account is the lag between CO2 inputs into the atmosphere (most human inputs also come from the northern hemisphere) and resulting increase in average global CO2 contents. The northern and southern hemispheres mix their atmospheric gases on a time scale of 1-2 years, so a dip in N-hemispheric emissions in 2020 would only arrive in Hawaii, where the main NOAA monitoring station is located, around 2021 to 2022! The full Keeling curve of atmospheric CO2 at Mauna Loa is shown in Figure 4, and shows the ongoing seasonal oscillation and the curved overall increase in CO2. If we use the CO2 emission values from Figure 1, we quickly deduce that not all that human CO2 stays in the atmosphere—in 2021 ~ 35 Gt CO2 was emitted, but that does not mean an increase of 4.5 ppm CO2 (35/7.8). As we saw earlier, the last decade saw a ~2 ppm increase per year. This partitioning of atmospheric CO2 between the atmosphere, oceans, and living biomass is roughly 43/30/27 % but is also slowly changing over time. The long-term instrumental record of CO2 in the atmosphere is known as the Keeling curve (Figure 4).
The important observation on the Keeling curve is the fact that it is not straight but curves upwards. This is in agreement with our CO2 emission curve (Figure 1), which also steepens upwards for most of it length. With decreases in CO2 emissions (Paris Accords), the Keeling curve will flatten, but it is important to note that with smaller CO2 emissions, atmospheric CO2 will not decrease but increase less rapidly. At carbon neutrality it may reach a fixed value that is still substantially higher than the 1958 value or the preindustrial value of 280 ppm CO2. So it will get warmer! Much warmer!
In various reports, the terms “net zero,” “carbon neutrality,” and “zero carbon emissions” around 2050 to keep the temperature below that canonical 2 oC rise are sometimes used interchangeably, which is not quite right. The CO2 that we pump into the air is about 50% taken up by the oceans and the northern hemispheric biomass (“trees”). The high atmospheric CO2 contents stimulates the photosynthetic activity of many plants, and that will not change when we decrease our CO2 emissions because the atmospheric CO2 levels remain high. The carbon in leaf matter from plants that is produced in spring and summer is largely returned during the rot+decay cycle in the fall and winter, but a small fraction is retained in soils and in tree trunks. The latter is the net carbon sink of the ecosphere. The oceans dissolve CO2, but the mixing processes in the oceans are very slow, while the ocean water volume is very large. Only the surface ocean equilibrates with the CO2 from the atmosphere, and that CO2-rich surface water then has to be mixed with deeper waters. The mixing time of the oceans is about 600-800 years, so it will be a long time before all ocean water has equilibrated with atmospheric CO2. The ocean CO2 sink also persists independent of the magnitude of the human CO2 emissions, because the whole ocean water volume has not yet equilibrated with the high atmospheric CO2 values.
So, we distinguish two scenarios:
- For “carbon neutrality” or “net zero” around 2050, we aim for strongly reduced, small CO2 emissions that will be fully taken up by the oceans and by the ecosphere, and through burial in soil. That means the CO2 contents of the atmosphere remain then near constant.
- For zero emissions, we emit zero CO2 in 2050, and that will lead to a gradual decline in atmospheric CO2 contents because the oceans and trees/soils keep storing some atmospheric CO2.